A few weeks ago (if you haven't noticed there's about a three week period between the time we do stuff in class and the day I write a post for it) we did what was called the "Enzyme Lab". This lab consisted of mixing 3ml of H2O2 (hydrogen peroxide) with 3ml of water (H20) , and adding an enzyme (yeast) to start a chemical reaction that produces O2. The way the experiment works is the enzyme breaks the Oxygen molecules off of the H2O and H2O2 and releases them. We measured the reaction with a pressure sensor that was hooked up to my mac (which sucks slightly less...). Of course no experiment would be complete without a few variables, so we did the experiment three different ways each time changing one aspect of it (we repeated each set three times in order to gain an accurate representation of data). The first time we changed the concentration of the enzyme (10 drops, 20 drops, 30 drops, 40 drops.), the second time we changed the temperature of the solution be for adding the enzyme (Hot, cold, warm, and room temp). The third time we substituted the water (H2O) for a pH solution (2, 7, or 10).
Concentration-
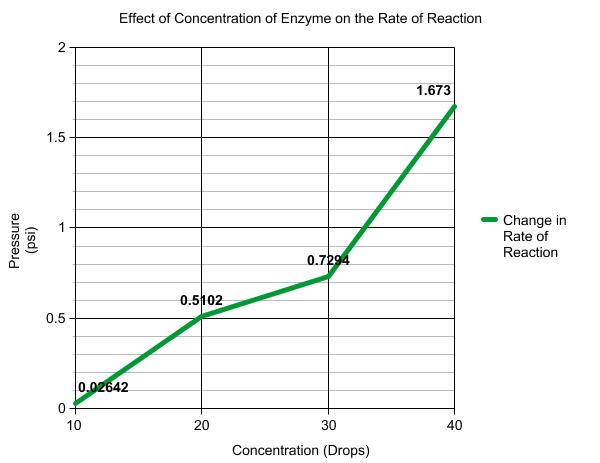
For this part of the experiment we varied the amount of enzyme that we added to the solution. The first time we only put 10 drops of yeast in. This gave us a rise of pressure of .02642 psi every .0626 minutes (known as the rate of reaction.) When we added 20 drops of yeast to the solution the amount of O2 produced was twenty times that of the 10 drops. You can tell this because the rate of reaction (.5102 psi per .626 seconds) is twenty time that of the 10 drop solution (.2643 psi every .0626 minutes). At 30 drops the rate of reactions seems to have found a new pattern for every 10 drops the rate of reaction goes up .2 psi every .0626 seconds. The biggest gain in rate of reaction is when you go from 30 drops to 40 drops, it goes from .7294 psi/.0626 seconds to 1.673 psi/.0626 seconds. Personally, I suspect that the last one wasn't 40 drops, but more like 80 (
Sierra didn't know what a drop was ;).... ). What we can learn from this experiment is the greater the concentration of enzymes, the larger the amount of O2.
Temperature-
So now that we know what happens when we vary the concentration of enzymes in our solution, it is time to find out what happens when we vary the temperature of the mixture. For this part of the experiment we used the same mixture of H2O2 and H2O, but we kept the amount of yeast at a constant (25 drops). Instead we put one test tube of the base solution in the freezer (0 degrees celsius), left one at room temperature (25 degrees), warmed one up to 38 degrees, and heated one up to 80 degrees. What we cal learn from this is that enzymes really hate hot temperatures. 80 degrees Celsius was just too hot because at higher temperatures enzymes become denatured. Freezing the solution also had poor effects on the enzymes production of O2. The perfect temperature for O2 production from enzymes is about 38 degrees Celsius. Room temperature yielded decent results compared to the other graphs, but 38 degrees just won the metaphorical race.
pH Levels-
Sierra, Sierra, Sierra....... Ok it wasn't her fault this time that our data is all defunketated (not a word but...oh well). Actually it was an equipment error. There is no way that the enzymes were making negative O2. We determined over the course of this post that it was an equipment error, so disregard the graph. What was supposed to happen was the enzymes would produce the most O2 when the pH level was normal (7) and less at 4 and 10 (which the graph slightly shows). To produce the varied pH levels we replaced the 3ml of H2O, in the base solution, with 3ml of the different pH solutions.


No comments:
Post a Comment